Journal of
Clinical & Medical Surgery
Clinical & Medical Surgery
www.jclinmedsurgery.com
ISSN 2833-5465
Open Access
Volume 5
Open Access
Volume 5
Su Lin*
*Corresponding Author: Su Lin
University of Chinese Academy of Sciences, China.
Email: 506904668@qq.com
Article Info
Received: Jun 09, 2025
Accepted: Jul 11, 2025
Published: Jul 18, 2025
Archived: www.jclinmedsurgery.com
Copyright: © Lin S (2025).
Abstract...
Objective: The invasive nature of oral cancer and distant metastasis usually lead to a poor prognosis and low survival rates for patients. Previous studies have confirmed the critical role of Procollagen Lysine-2-Oxoglutarate-5-Dioxygenase 2 (PLOD2) in the occurrence and progression of various cancer types. However, there are few reports on PLOD2 in oral cancer. This study first conducts a bioinformatics analysis, followed by experimental research using pathological tissue sections from Oral Cancer (OCC) and oral squamous cancer cells to investigate the expression of PLOD2 in oral cancer tissues and its impact on the biological behavior of oral cancer.
Methods: (1) Analyze TCGA bioinformatics data using R language to screen for differentially expressed genes related to Head and Neck Squamous Cell Carcinoma (HNSC), perform LASSO analysis for COX regression to predict target genes, and analyze the target genes in conjunction with clinical pathological characteristics. (2) Collect pathological tissue specimens from 49 oral cancer patients in the pathology department of XX Hospital from 2018 to 2020, and detect the expression of PLOD2 in oral cancer tissues using immunohistochemistry, analyzing its clinical significance in conjunction with clinical pathological data. (3) Use Quantitative Real-Time Polymerase Chain Reaction (qRT-PCR) and Western Blot (WB) assays to detect the expression of PLOD2 mRNA and protein in oral squamous cell carcinoma HSC-2, HN4 cells, and Human Oral Keratinocytes (HOK). (4) Construct PLOD2 lentiviral knockdown plasmids and empty control plasmids, named shRNA-PLOD2 and shRNA-NC, respectively. Knock down PLOD2 in oral squamous cell carcinoma HSC-2 and HN4 cells with high PLOD2 expression. Observe transfection efficiency using a fluorescence inverted microscope, and further clarify the knockdown effect using qRT-PCR and WB techniques. (5) Observe the effects of PLOD2 on the proliferation, colony formation, migration, and invasion of oral squamous cell carcinoma HSC-2 and HN4 cell lines through in vitro experiments. (6) This study uses SPSS 26.0 for data analysis. Measurement data conforming to a normal distribution are represented as mean ± standard deviation. Independent sample t-tests are used for comparisons between two groups, and one-way ANOVA is used for comparisons among multiple groups. Count data are expressed as frequency (percentage) [n(%),] and intergroup comparisons are made using the Chi-square test or Fisher’s exact probability method. A p-value of <0.05 indicates statistical significance (*P<0.05, **P<0.01).
Results: (1) The analysis of bioinformatics data identified the target gene PLOD2, which was simultaneously validated for high expression in HNSC on two online data analysis platforms. The GEPIA data platform indicated that the expression of PLOD2 is associated with tumor stage and overall survival. The TCGA data platform revealed that PLOD2 expression is related to the degree of differentiation in HNSC. (2) Immunohistochemical results showed that the positive expression rate of PLOD2 in oral cancer was 76.2%, significantly higher than the 14.3% in non-cancerous tissues, with a statistically significant difference (P<0.05). However, no significant correlation was found between the expression of PLOD2 and any clinical pathological features. (3) Results from cell experiments indicated that the expression level of PLOD2 in oral squamous cell carcinoma cell lines HSC-2 and HN4 was significantly higher than that in Human Oral Keratinocytes (HOK). The oral squamous cell carcinoma cell lines HSC-2 and HN4 successfully stably transduced with the PLOD2 knockdown lentiviral plasmid (shRNA-PLOD2) demonstrated that knockdown of PLOD2 significantly inhibited the migration and invasion of OSCC cell lines HSC-2 and HN4 in vitro, compared to the knockdown control group (shRNA-NC).
Conclusion: PLOD2 is highly expressed in HNSC and is associated with the clinical pathological features of HNSC patients. PLOD2 is also highly expressed in oral cancer tissues and oral squamous cell carcinoma cells, and knockdown of PLOD2 can significantly inhibit the migration and invasion of oral squamous carcinoma cells HSC-2 and HN4 in vitro. This suggests that PLOD2 has potential value in predicting the prognosis of oral cancer. PLOD2 acts as an oncogene in the progression of oral cancer, indicating that it may serve as a target for oral cancer therapy, providing a basis and assistance for the prevention, diagnosis, treatment, and prognosis assessment of oral cancer.
Keywords: Oral cancer; PLOD2; Oncogene; Invasion; Migration
Citation: Lin S. Effect of PLOD2 on the malignant biological behavior of oral cancer. J Clin Med Surgery. 2025; 5(2): 1197.
Introduction
According to the latest cancer statistics from the Global Cancer Epidemiology Database, there were approximately 19.29 million new cancer cases and 9.96 million cancer deaths worldwide in 2020, with 49.3% of the incidence and 58.3% of the mortality occurring in Asia. Head and Neck Cancer (HNC), as one of the most common malignant tumors globally, encompasses related diseases of multiple organs, including tumors of the neck, oral and maxillofacial tumors, and tumors of the ear and nose. Oral cancer, as a common type of lesion in head and neck tumors, accounts for 4.7% to 20.3% of head and neck tumors and is the sixth leading cause of cancer-related death. It is characterized by early clinical symptoms that are often hidden, a high probability of malignant changes, and a tendency to invade normal tissues and lead to cervical lymph node metastasis. Despite advancements in cancer treatment, the prognosis for oral cancer remains poor, with a 5-year survival rate of less than 50%. In recent years, targeted therapy and targeted drug delivery systems have been introduced as promising treatment methods in clinical practice. Consequently, there has been a growing focus on targeted therapies that offer advantages such as high precision and fewer adverse reactions.
Over the past decade, The Cancer Genome Atlas (TCGA) project has collected multi-platform molecular profiles and their clinical pathological annotation data for over 11,000 human tumors across 33 different types of cancer, including key clinical outcomes such as Overall Survival (OS), Progression Free Interval (PFI), Disease Free Interval (DFI), and Disease Specific Survival (DSS), at an unprecedented scale to study cancer biology using clinically relevant features. Therefore, we utilized TCGA to identify differentially expressed genes associated with survival in Head and Neck Squamous Cell Carcinoma (HNSC), and performed LASSO analysis for COX regression, revealing Procollagen Lysine-2-Oxoglutarate-5-Dioxygenase (PLOD2) as an effective predictive gene for HNSC.
Current research evidence indicates that tumor progression is determined not only by tumor cells but also by the Tumor Microenvironment (TME). The Extracellular Matrix (ECM), as a major component of the tumor microenvironment, plays a crucial role in tumor progression. The ECM is composed of various components, with collagen being the most abundant structural protein that serves as a stable scaffold for the ECM. Increasing studies suggest that the interactions between collagen and cells may trigger biochemical or biological signals that affect normal biological functions and cancer development. Collagen is no longer viewed merely as a barrier to cancer cell invasion and migration, but rather as a “highway” facilitating cancer cell migration and invasion. PLOD2 possesses lysine hydroxylase activity, catalyzing the hydroxylation of lysine residues in procollagen, promoting collagen cross-linking and maturation. It is currently the only identified target molecule involved in collagen molecular hydroxylation and is a key gene mediating stable collagen cross-link formation. Therefore, PLOD2 may play an important role in cancer progression. Previous studies have shown that PLOD2 is highly expressed in various cancer types, including osteosarcoma, glioma, breast cancer, and laryngeal cancer. Overexpression of PLOD2 activates the Wnt signaling pathway, enhances tumor stem cell-like properties in human laryngeal squamous carcinoma Hep-2 cells and human hypopharyngeal squamous carcinoma FaDu cells, and confers resistance to laryngeal squamous cell carcinoma both in vitro and in vivo. Thus, PLOD2 may serve as a prognostic marker for laryngeal cancer.
However, the expression of PLOD2 in oral cancer and its potential involvement in the invasion and metastasis of oral cancer remain unclear. Considering the potential malignancy of PLOD2, this study aims to determine the expression differences of PLOD2 in HNSC compared to adjacent normal tissues through bioinformatics data, followed by a correlation analysis with clinical pathological features. Additionally, we will analyze the expression of PLOD2 in oral cancer tissues through immunohistochemical experiments and perform a correlation analysis with clinical pathological features. Finally, we will further explore the impact of PLOD2 on the malignant biological behavior of oral cancer through in vitro cell experiments, assessing its biological function in oral cancer.
Part one:
Expression of plod2 in oral cancer and its clinical significanceMaterials and methods (main materials and instruments)
Sources of oral cancer medical records and specimens: Patients diagnosed with oral cancer at XX Hospital from 2018 to 2020 were selected for the experimental group of this study, and pathological slices of non-cancerous oral tissue were included as the control group for immunohistochemical experiments. Inclusion criteria for the study subjects were as follows: complete clinical data, a diagnosis of oral malignant tumor confirmed by pathological tissue or cytological examination, no other oral diseases, and no preoperative radiotherapy, chemotherapy, or immunotherapy. The exclusion criteria included patients with tumors in other sites. A total of 49 cases were included in this study, consisting of 42 cases of oral cancer tissue and 7 cases of non-cancerous oral tissue.
Sources of cell lines
The Human Oral Keratinocyte cell line (HOK) and the human oral cancer cell line (HN4) used in this experiment were provided by XX Hospital (Beijing, China). The human oral cancer cell line HSC-2 was purchased from XX Company. The cells were cultured in DMEM medium containing 10% fetal bovine serum and 1% streptomycin and penicillin; HSC-2 cells were cultured in medium containing 10% fetal bovine serum, 1 mM sodium pyruvate solution, and 1% MEM non-essential amino acid solution. All cells were maintained in a 37°C incubator with 5% CO2.
Experimental methods
Construction of the PLOD2 predictive risk assessment model: (1) HNSC-related information from the TCGA database was downloaded using the UCSC Xena data platform (http://xena.ucsc.edu). The “tidyverse” package in R was utilized to analyze differentially expressed genes (at the mRNA level) between HNSC tissues and adjacent normal tissues. Lasso analysis and Cox regression were performed, and risk scores were calculated according to the regression coefficients and expression levels of each gene, where risk score = (coefficient * expression of the gene). Genes associated with HNSC survival were identified, and prognostic analysis was conducted. The SingerBox online platform was used to analyze the expression of PLOD2 from the Xena database in relation to clinical pathological information (including age, location, tumor size, lymph node metastasis, and TNM staging).
Extraction of total RNA from cells: Collect the precipitates of the logarithmically growing human oral keratinocyte cell line HOK and oral cancer cells HSC-2 and HN4, and extract RNA using the VenoQ FastPure Cell/Tissue Total RNA Isolation Kit V2. Following the manufacturer’s instructions, reagents were added sequentially to extract the RNA. The concentration and purity of RNA were determined using an ultramicro spectrophotometer.
Reverse transcription to synthesize cDNA
(1) cDNA was synthesized using the VenoQ HiScript II RT SuperMix for qRT-PCR (+gDNA wiper) kit.
(2) The following system was prepared for each tube according to the manufacturer’s instructions:
Geneomic DNA removal.
| Prepare the following mixture in an RNase-free centrifuge tube | |
|---|---|
| RNase-free ddH2O | to 16 uL |
| 4xgDNA wiper Mix | 4 uL |
| TemplateRNA | Total RNA: 1pg-1 ug |
(3) Prepare the reaction mixture according to the components in the table on ice, and gently mix using a pipette. Incubate at 42°C for 2 minutes.
(4) Directly add 4 µL of 5x HScript III qRT SuperMix to the reaction system from the first step, bringing the total reaction volume to 20 µL. Gently mix using a pipette.
(5) Perform the reverse transcription reaction: incubate at 37°C for 15 minutes, then at 85°C for 5 seconds. The products should be immediately used in qPCR reactions.
Primer design and synthesis
The primer sequences used in this experiment were obtained from the literature and synthesized by Qingke Biological Company. The specific sequences are as follows:
| Gene Name | Primer Sequences |
|---|---|
| PLOD2 | Upstream: CATGGACACAGGATAATGGCTG |
| Downstream: AGGGGTTGGTTGCTCAATAAAAA | |
| GAPDH | Upstream: GAAGGTGAAGGTCGGAGTC |
| Downstream: GGCTGTTGTCATACTTGTCATGG |
Real-time fluorescent quantitative PCR
(1) This study used the SuperReal PreMix Plus (SYBR Green) kit from China Tiangen Biotech for detection, and all preparations were made on ice.
(2) Prepare the following reaction system according to the manufacturer’s instructions(20μL):
| Reagent components | Reagent system |
|---|---|
| 2x SuperReal PreMix Plus | 10 μL |
| Forward Primer (10 μM) | 0.6 μL |
| Reverse Primer (10 μM) | 0.6 μL |
| cDNA Template | 2 μL |
| 50x ROX Reference Dye | 0.4 μL |
| RNase-free ddH2O | 6.4 μL |
(3) For each group of samples, design three replicates, aliquot the prepared reaction system into 8-tube strips, label the internal control and target genes, and mix well.
(4) Place the 8-tube strips into the real-time quantitative PCR instrument for qRT-PCR reaction. The specific reaction program should not deviate from the primers. The basic program is as follows: 95°C for 15 minutes; 94°C for 20 seconds; 60°C for 34 seconds; for a total of 45 cycles.
(5) qRT-PCR Data Analysis: The relative expression level of PLOD2 in each group of samples was calculated using the 2-ΔΔCt method, where ΔΔCt = [Oral squamous carcinoma tissue/cell line (Ct(miR-375) Ct(U6))] [Adjacent normal tissue/ normal oral mucosal epithelial cell line (Ct(miR-375) Ct(U6))].
Extraction of cellular proteins
(1) Discard the cell culture medium, collect logarithmically growing cells, rinse with PBS, digest with trypsin, discard the supernatant, and resuspend the cell pellet in 1 mL of PBS. Wash the cell pellet twice and transfer it to a new EP tube, discard the supernatant, and collect the cell pellet.
(2) Prepare RIPA lysis buffer and PSFM protease inhibitor at a ratio of 100:1. Add an appropriate amount of lysis buffer based on the number of cells, vortex until there are no visible cell clumps or mucus, and lyse on ice for 30 minutes, vortexing every 10 minutes. Perform all steps on ice.
(3) Centrifuge at 14,000 rpm at 4°C for 30 minutes, aspirate the supernatant, discard the pellet, and transfer the supernatant to a new EP tube.
(4) Mix the supernatant with pre-thawed SDS-PAGE sample loading buffer (5X) at a 1:4 ratio, then immediately place it in a 95°C metal bath for heating for 10 minutes. Allow it to cool gradually in a 4°C refrigerator, then store it at -80°C for longterm preservation.
Protein immunoblotting (Western blot) experiment
(1) Select a gel with an appropriate concentration based on the molecular weight of the target protein. Prepare different proportions of the separating gel according to the manufacturer’s instructions, taking approximately 1 hour.
(2) In this laboratory, the Biorad kit is used with 1.0 mm thick glass plates and a 15-well electrophoresis comb. Before running the gel, prepare 5× Tris electrophoresis solution to a 1× concentration. Load samples, with a constant voltage of 80V for 30 minutes, then increase to 120V for 50 minutes to run the gel. Cut the gel from the gel plate and place it in a tray containing transfer buffer. Cut an appropriate size of PVDF membrane based on the target band size and activate it in methanol for 2-10 minutes.
(3) Pre-chill the transfer buffer beforehand. According to the “black gel-white membrane” principle, place the transfer bands and gel, with filter paper on both sides to hold the transfer clamp. Place the transfer box in a basin filled with ice, and perform the transfer according to molecular weight sizes. Block with blocking solution at room temperature on a shaker for 2 hours to reduce non-specific binding of antibodies. Prepare the primary antibody working solution and incubate overnight on a rotating shaker at 4°C. Wash the membrane with TBST three times on a shaker for 10 minutes each. Place the PVDF membrane in a 15 mL centrifuge tube containing the secondary antibody working solution (1:1000) and incubate on a rotating shaker at room temperature for 2 hours.
(4) After the secondary antibody incubation, wash the membrane with TBST at room temperature three times for 10 minutes each. Expose the PVDF membrane to imaging software, take photos, and use Image J software to analyze gray values.
Experimental methods
Cell culture, the method is the same as in the first section
Lentivirus infection of target cells and drug pressure selection of stable strains:
(1) Plate HN4 and HSC-2 cells in a 6-well plate. Once the cells adhere and grow to 40%, 60%, or 80%, collect the cells into a new EP tube, labeling the tube with the cell name and transfection name.
(2) Add transduction reagent 1 to each EP tube followed by lentivirus, and place it in a 37°C incubator. Gently flick the EP tube every 20 minutes to ensure thorough mixing of the cells with the lentivirus and transduction reagent, for a total of 3 flicks.
(3) Prepare the culture medium with 2 mL of complete medium for each well. Add transduction reagent 2 to the 6-well plate at a ratio of 1000:1 relative to the medium, mix well with the lentivirus-containing cells, and then add to the 6-well plate, labeling with the cell name.
(4) After 24 hours, wash the cells with pre-warmed PBS and change the medium.
(5) After 48 hours, observe the transfection efficiency via fluorescence. The concentration of puromycin is used according to the manufacturer’s instructions (7 µg/mL) for drug selection for 7-14 days, selecting resistant clones for further expansion.
Extraction of cellular proteins and RNA, determination of total RNA concentration and purity, reverse transcription to synthesize cDNA, primer design and synthesis, qRT-PCR, and western blot to detect PLOD2 knockdown expression levels, he methods are the same as in the first section
Cell proliferation ability detection
(1) Digest and centrifuge logarithmically growing cells to form a cell suspension, and vortex for uniformity, performing at least 40 vortexes per group before counting the cells.
(2) Set three replicates for each group, seeding 2000 cells per well to calculate cell numbers. Prepare the cell suspension in complete culture medium, mixing thoroughly and inseminating with 100 µL working solution in each well of a 96-well plate. PBS is added around the experimental and control groups to prevent moisture evaporation.
(3) At 24h, 48h, 72h, and 96h post-seeding, add CCK-8 solution, prepared at a ratio of complete medium to CCK-8 reagent of 10:1, replacing the culture medium in each well with the one containing CCK-8 for the measurements needed that day.
(4) Place the 96-well plate in the incubator for 2 hours, then measure absorbance at a wavelength of 450 nm.
Plate colony formation
(1) Digest and centrifuge logarithmically growing cells to form a cell suspension, and vortex for uniformity, performing at least 40 vortexes per group before counting the cells.
(2) Conduct colony experiments in 6-well plates, seeding 1000 cells per well to calculate cell numbers and prepare a cell suspension in complete medium. Ensure each well has enough liquid volume to reach 2.5 mL. Mix the plate thoroughly to distribute cells evenly.
(3) Change the medium every 3 days or so, carefully adding along the side walls to prevent dislodging the cells.
(4) Continue culturing until visible cell clusters of about 50 cells can be seen under a microscope, typically taking 7-14 days. Remove the colony plate for fixation and staining.
(5) Rinse with PBS buffer along the side until the background is clear. Then, add 1 mL of 4% paraformaldehyde fixative along the side wall, fix at room temperature for 30 minutes.
(6) Use 4% paraformaldehyde fixative for 30 minutes and stain with 0.1% crystal violet in the dark for 15 minutes.
(7) Take photos and use ImageJ software to count colonies, compiling statistical results to analyze cell colony formation ability.
Scratch healing experiment
(1) Draw two lines spaced 1 cm apart on the back of a 6-well plate with a marker, preparing fixed positions for subsequent photos of the scratches.
(2) Digest and centrifuge logarithmically growing cells to form a cell suspension, vortex for uniformity, performing at least 40 vortexes per group before counting the cells.
(3) Calculate the cell number to plant 3 × 10⁵ cells per well using complete medium to prepare a cell suspension. Mix thoroughly and plant in each well, ensuring each well reaches 2.5 mL.
(4) After cells have adhered and grown to 90%, discard the original cell culture medium and wash the cells with PBS buffer along the side walls, 1 mL for each wash, twice.
(5) Use a 200 μL pipette tip to make the scratch in a straight line, ensuring the scratches are vertical to the bottom of the wells and closely adhering to the bottom wall with consistent pressure and spacing.
(6) Gently wash the wells with PBS buffer again, remove any cells dislodged by the scratch. Then add 2.5 mL of serum-free medium.
(7) Immediately take a photo of the scratch at time 0 hours. Record the photographing position and take another photo at the same position after 24 hours to calculate the wound healing ability.
(8) Use Image J software for data calculation, and Prism 9 for statistical analysis.
Cell invasion ability measurement
(1) Thaw the matrix gel stored at -20°C by placing it in the refrigerator at 4°C overnight, to be used after 12 hours.
(2) Dilute 200 µL of pre-chilled matrix gel with 1.6 mL of pre-chilled serum-free medium at 4°C and spread evenly in the bottom of a Transwell chamber. Incubate in the incubator for 3 hours.
(3) Remove the 24-well plate containing the Transwell chambers from the incubator, and allow them to air dry overnight in a sterile laminar flow hood for use the next day.
(4) On the day of use, remove any excess matrix gel from the bottom of the Transwell chamber and wash the chamber with 100 µL of serum-free medium. Place it back at 37°C for 1 hour.
(5) After 1 hour, remove the 24-well plate and aspirate the medium. Digest logarithmically growing cells, forming a cell suspension, vortex for uniformity, performing at least 40 vortexes per group before counting the cells.
(6) Calculate the cell number to plant 2 × 10⁴ cells per well in the upper chamber with 200 µL of serum-free medium prepared from the cell suspension.
(7) In the lower chamber, add 600 µL of complete medium containing 10% fetal bovine serum and incubate in the incubator for 36 hours.
(8) Carefully remove the Transwell chamber with tweezers, aspirate the upper chamber liquid, and gently wash with PBS buffer, using a wet cotton swab to remove any uninvaded cells from the upper chamber.
(9) In the lower chamber, add 800 µL of 70% methanol to fix the invading cells for 30 minutes, then aspirate the methanol and wash the wells.
(10) Add 0.1% crystal violet staining solution to the lower chamber in the dark for 15 minutes, and after 15 minutes, wash slowly in PBS buffer, using cotton swabs to wipe off residual crystal violet on the outer and inner side walls of the chamber.
(11) Randomly select 5 different fields under the microscope to count the number of invading cells per well.
(12) Use Image J software for data processing and Prism for statistical analysis.
Statistical analysis
In this study, data analysis was conducted using SPSS 26.0. For continuous data that followed a normal distribution, values are presented as mean ± standard deviation. Independent sample t-tests were used for comparisons between two groups, while one-way ANOVA was used for comparisons among multiple groups. Count data are expressed as frequency (proportion) [n(%)] and intergroup comparisons were made using the Chi-square test or Fisher’s exact probability method. A p-value of <0.05 was considered statistically significant (*P<0.05, **P<0.01).
Results
Selected target gene
UCSC Xena (http://xena.ucsc.edu) is an online data download and analysis platform based on the TCGA. We conducted an in-depth analysis of publicly available data from TCGA. The study first utilized the UCSC Xena database to download HNSC-related information. Using R language, we set the p-value threshold to <0.05 and screened for 1,830 genes that exhibited differential expression at the mRNA level between HNSC tissues and adjacent normal tissues. We performed Lasso analysis and Cox regression on these differentially expressed genes and identified 11 genes associated with the survival of HNSC patients, including STC2, TIMP4, PLAU, ADPRHL1, GNG7, ADA, PLOD2, CDKN2A, DSCAM, ANO1, and SYT1. A multivariable COX regression model confirmed that the expression levels of six genes—STC2, TIMP4, ADPRHL1, PLOD2, DSCAM, and ANO1—were negatively correlated with survival (Figure 1). We further analyzed and compared the prognostic levels of six target genes in hundreds of cases of HNSC using the GEPIA platform (http:// gepia.cancer-pku.cn). The results indicated that PLOD2 is highly expressed in tumor tissues, and HNSC patients with high PLOD2 expression have poorer survival. Additionally, the expression of PLOD2 is higher in advanced HNSC tissues than in early-stage tissues, with statistically significant differences (*P<0.05) (Figure 2). These findings encourage us to target PLOD2 and further investigate the relationship between PLOD2 expression levels and clinical pathological factors.
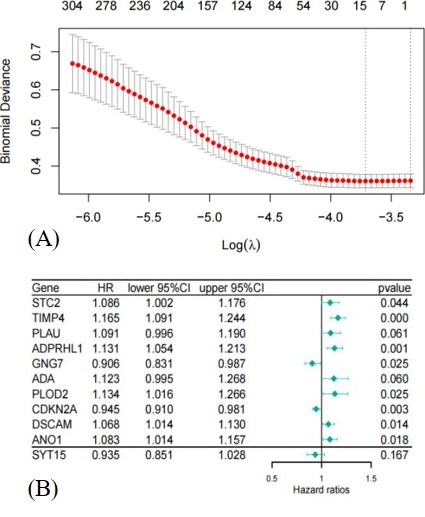
Figure 1: (A) LASSO regression analysis to construct prognostic genes associated with HNSC. (B) Cox Regression analysis model to screen genes negatively correlated with survival.
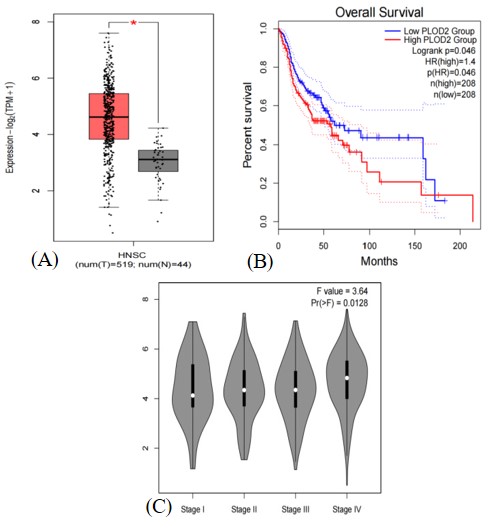
Figure 2: (A) Differential expression of PLOD2 in HNSC. (B) Survival analysis of PLOD2 expression in HNSC. (C) PLOD2 expression and clinical staging in HNSC.
Table 1: Analysis of the relationship between PLOD2 expression and clinical pathological features in HNSC.
| Pathological features | High (n=142) | Low (n=139) | (n=281) | P value | FDR | |
|---|---|---|---|---|---|---|
| Gender | Man | 44(15.66%) | 46(16.37%) | 90(32.03%) | 08 | 1 |
| Female | 98(34.88%) | 93(33.10%) | 191(67.97%) | |||
| Location | Buccal | 10(3.56%) | 9(3.20%) | 19(6.76%) | 0.2 | 0.61 |
| Floor of the mouth | 26(9.25%) | 31(11.03%) | 57(20.28%) | |||
| Hard palate | 1(0.36%) | 5(1.78%) | 6(2.14%) | |||
| Lip | 0(0.0e+0%) | 3(1.07%) | 3(1.07%) | |||
| Tongue | 69(24.56%) | 62(22.06%) | 131(46.62%) | |||
| Others | 36(12.81%) | 29(10.32%) | 65(40.21%) | |||
| Tumor size | T1 | 6(2.14%) | 13(4.63%) | 19(6.76%) | 0.09 | 0.45 |
| T2 | 45(16.01%) | 51(18.15%) | 96(34.16%) | |||
| T3 | 36(12.81%) | 38(13.52%) | 74(26.33%) | |||
| T4 | 55(2.85%) | 37(1.78%) | 92(4.63%) | |||
| Lymph node metastasis | N0 | 65(23.13%) | 83(29.54%) | 148(52.67%) | 0.13 | 0.52 |
| N1 | 33(11.74%) | 23(8.19%) | 56(19.93%) | |||
| N2 | 42(14.95%) | 32(11.39%) | 74(26.33%) | |||
| N3 | 2(0.71%) | 1(0.36%) | 3(1.07%) | |||
| Distant metastasis | M0 | 141(50.18%) | 138(49.11%) | 279(99.29%) | 1 | 1 |
| M1 | 1(0.36%) | 1(0.36%) | 2(0,71%) | |||
| Staging | Stage I | 3(1.07%) | 7(2.49%) | 10(3.56%) | 0.07 | 0.42 |
| Stage II | 31(11.03%) | 42(14.95%) | 73(25.98%) | |||
| Stage III | 29(10.32%) | 33(11.74%) | 62(22.06%) | |||
| Stage IV | 79(26.33%) | 57(19.22%) | 136(45.55%) | |||
| Differentiation | G1 | 9(3.20%) | 33(11.74%) | 42(14.95%) | 0.00047* | 0.0033 |
| G2 | 96(34.16%) | 80(28.47%) | 176(62.63%) | |||
| G3 | 36(12.81%) | 24(8.54%) | 60(21.35%) | |||
| G4 | 1(0.36%) | 2(0.71%) | 3(1.07%) |
Next, the study focused on the clinical pathological characteristics of oral cancer patients (n=281) with complete pathological information from the TCGA database and their association with PLOD2 expression. The results indicated that high expression of PLOD2 mRNA in tumors is associated with the degree of differentiation (**P<0.01).
Analysis of the correlation between PLOD2 expression levels in oral cancer tissues and clinical pathological parameters
Using the scoring method, the immunohistochemical staining results of oral cancer tissues and non-cancerous tissues were statistically analyzed. It was found that PLOD2 protein is primarily expressed on the cell membrane, and the positive staining rate of PLOD2 in oral cancer tissues is high, whereas there is no or minimal expression in non-cancerous tissues. The positive expression rate of PLOD2 in oral cancer is 76.2%, significantly higher than the 14.3% positive expression rate in non-cancerous tissues, with a statistically significant difference (P<0.05) (Table 2).
Table 2: Expression of PLOD2 in oral cancer tissues and non- cancerous tissues.
| Pathological features | (+) | (-) | n(Sample) | χ2 | P |
|---|---|---|---|---|---|
| Oral cancer tissues | 32(76.2) | 10(23.8) | 42 | 7.83 | 0.005* |
| Non-cancerous tissues | 1(14.3) | 6(85.7) | 7 |
This study analyzed the immunohistochemical scoring results of pathological slices from 41 OCC patients with complete data, in relation to their clinical pathological characteristics, including gender, age, tumor location, tumor size, lymph node metastasis, and muscle and gland infiltration. Unfortunately, the analysis revealed that the expression of PLOD2 in OCC tissues was not associated with any pathological features, and the differences were not statistically significant (P>0.05) (Table 3).
Expression levels of PLOD2 in oral cancer cells
We examined the differences in mRNA and protein expression levels of PLOD2 in human oral cancer cell lines HSC-2 and HN4, as well as in normal human oral keratinocyte cell line HOK, using qRT-PCR and Western blot analysis. The results indicated that at the RNA level, PLOD2 expression in HSC-2 was higher than in HOK (P=0.0439), and PLOD2 expression in HN4 was significantly higher than in HOK (P<0.0001). Similarly, at the protein level, compared to normal oral keratinocytes HOK, the PLOD2 protein expression in oral cancer cell lines HSC-2 and HN4 was relatively high (Figure 3).
PLOD2 promotes invasion and migration of oral cancer cells
Results
PLOD2 knockdown effect assessment
We constructed PLOD2 shRNA lentiviral knockdown plasmids and empty vector control plasmids, named shRNA-PLOD2 and shRNA-NC, respectively. PLOD2 was knocked down in the high PLOD2-expressing oral squamous cell carcinoma cell lines HSC-2 and HN4. The transfection efficiency was observed using a fluorescence inverted microscope (Figure 4). qRT-PCR was used to measure PLOD2 mRNA expression levels. The results showed that the mRNA expression level of PLOD2 in the stable transfected HSC-2 cell line with the shRNA-PLOD2 plasmid was significantly lower compared to the empty vector control group and the non-transfected group (NC) (P=0.0018, P<0.0001). There was no significant difference in PLOD2 mRNA expression levels between the NC and shRNA-NC groups (P=0.3921). In the stable-transfected HN4 cell line with the PLOD2 shRNA lentiviral plasmid, the mRNA expression level of PLOD2 was significantly lower compared to the empty vector control and non-transfected groups (P=0.0121, P=0.0082), while there was no significant difference between the NC and shRNA-NC groups (P=0.0711). Western blotting was performed to detect the expression of PLOD2 protein in HN4 and HSC-2 cell lines after knockdown. The results showed that the protein expression levels of PLOD2 in the shRNA-PLOD2 groups of both HN4 and HSC-2 were significantly lower than those in the shRNA-NC groups, with statistically significant differences (Figure 5). This confirms the effectiveness of the knockdown.
Table 3: Relationship between PLOD2 expression and clinical pathological features in OCC.
| Pathological features | (+) | (-) | n(Sample ) | χ2 | P |
|---|---|---|---|---|---|
| Gender | |||||
| Male | 17(70.83) | 7(29.17) | 24 | 0.331 | 0.565 |
| Female | 15(83.33) | 3(16.67) | 18 | ||
| Age | |||||
| ≥60 | 18(72) | 7(28) | 25 | 0.163 | 0.686 |
| <60 | 14(82.35) | 3(17.65) | 17 | ||
| Location | |||||
| Gingiva | 3(75) | 1(25) | 4 | 0.026 | 0.999 |
| Buccal | 9(75) | 3(25) | 12 | ||
| Tongue | 13(76.47) | 4(23.53) | 17 | ||
| Other Sites | 7(77.78) | 2(22.22) | 9 | ||
| Tumor size | |||||
| T1+T2 | 20(83.33) | 4(16.67) | 24 | 0.79 | 0.374 |
| T3+T4 | 12(66.67) | 6(33.33) | 18 | ||
| Lymph node metastasis | |||||
| N0 | 11(61.11) | 7(38.89) | 18 | 4.48 | 0.106 |
| N1 | 8(80) | 2(20) | 10 | ||
| N2 | 13(92.86) | 1(7.14) | 14 | ||
| TNM | |||||
| Ⅰ+Ⅱ | 27(84.38) | 5(15.63) | 32 | 3.249 | 0.071 |
| Ⅲ+IV | 5(50) | 5(50) | 10 | ||
| Muscle invasion | |||||
| NO | 26(72.22) | 10(27.78) | 36 | 0.924 | 0.336 |
| YES | 6(100) | 0(0) | 6 | ||
| Glandular invasion | |||||
| NO | 29(76.32) | 9(23.68) | 38 | 0.003 | 0.953 |
| YES | 3(75) | 1(25) | 4 | ||
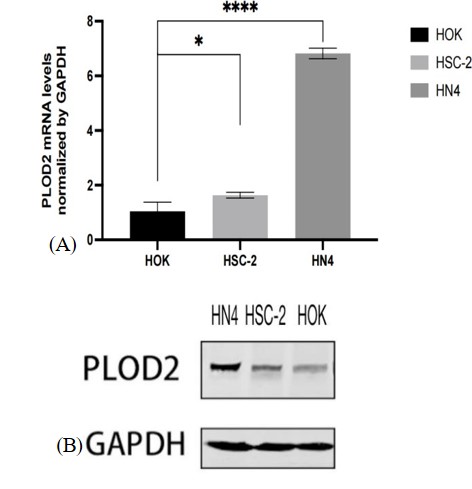
Figure 3: (A) High expression of PLOD2 mRNA in HSC-2 and HN4. (B) High expression of PLOD2 protein in HSC-2 and HN4.
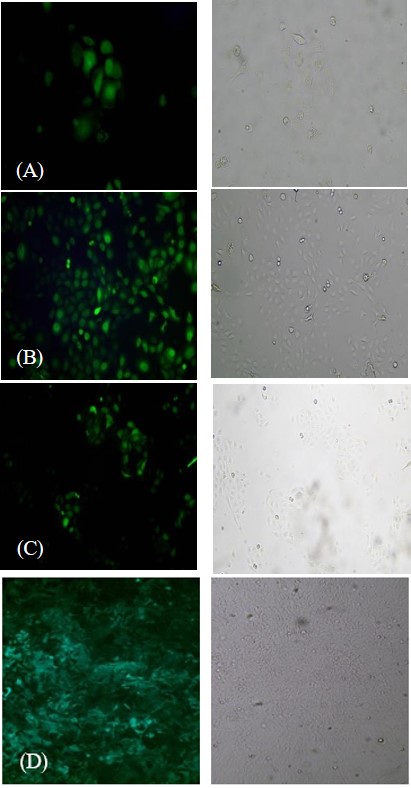
Figure 4: (A & B) Transfection efficiency of HSC-2 with shRNAPLOD2 and shRNA-NC (C & D) Transfection efficiency of HN4 with shRNA-PLOD2 and shRNA-NC.
PLOD2 is not associated with the proliferative ability and colony formation of oral cancer cells
The proliferative ability of OSCC cell lines stably transduced with PLOD2 shRNA lentiviral plasmids was measured using the CCK-8 proliferation assay, compared to the empty vector control group and the non-transfected group (NC). The results showed that in both HSC-2 and HN4 cells, the shRNA-PLOD2 group did not significantly inhibit cellular proliferation, and the differences were not statistically significant (P>0.05) (Figure 6).
In the colony formation assay, it was observed that the shRNA-PLOD2 group did not significantly inhibit cell colony formation compared to the shRNA-NC group, and the differences were not statistically significant (P>0.05). Similar results were obtained in both HSC-2 and HN4 cells (Figure 7).
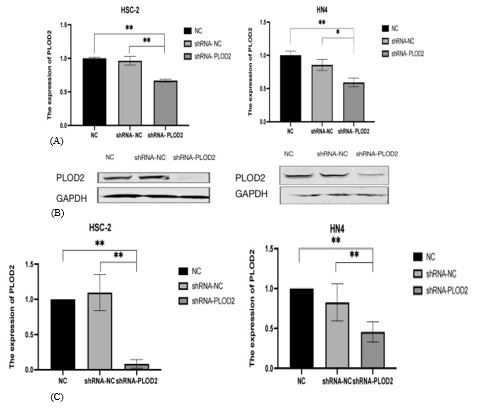
Figure 5: (A) qRT-PCR validation of transfection efficiency in HSC-2 and HN4 with shRNA-PLOD2. (B) Western blot validation of transfection efficiency in HSC-2 and HN4 with shRNA-PLOD2.
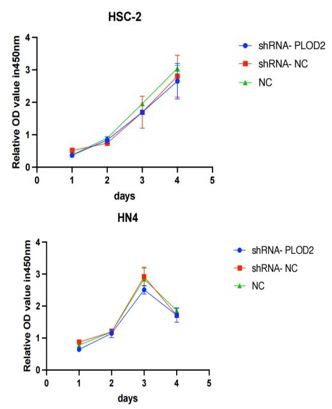
Figure 6: CCK-8 proliferation assay to measure proliferative ability of shRNA-PLOD2 HSC-2 and HN4 cell lines (P>0.05).
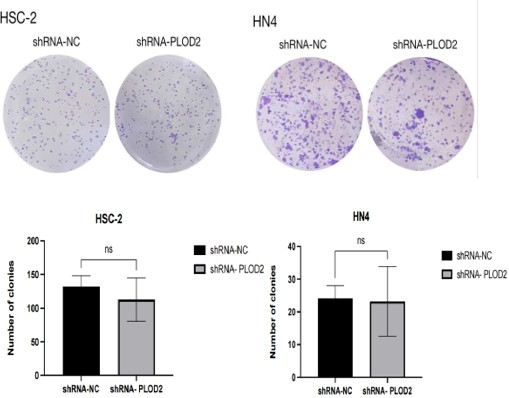
Figure 7: Colony formation assay to measure colony formation ability of shRNA-PLOD2 HN4 and HSC-2 cell lines (P>0.05).
PLOD2 promotes migration and invasion of oral cancer cells
Compared to the shRNA-NC group, the wound healing ability of HSC-2 cells in the shRNA-PLOD2 group was significantly reduced (P=0.006). Additionally, in the case of HN4 cells, the closure of the scratch in the shRNA-PLOD2 group was significantly delayed compared to the shRNA-NC group (P=0.0008), with statistically significant differences (Figure 8).
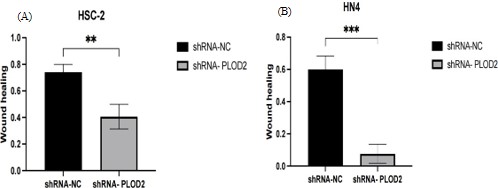
Figure 8: Cell Scratch Wound Healing Assay to Measure Migration Ability of shRNA-PLOD2 HN4 and HSC-2 Cell Lines (P<0.05). (A) Wound Healing Ability of HSC-2 with shRNA-PLOD2 and shRNA-NC. (B) Wound Healing Ability of HN4 with shRNAPLOD2 and shRNA-NC.
The results of the Transwell invasion assay showed that, compared to the shRNA-NC group, the number of HSC-2 cells that migrated through the Transwell chambers with Matrigel in the shRNA-PLOD2 group was significantly decreased (P=0.0059). Similarly, the invasion ability of HN4 cells in the shRNA-PLOD2 group was also significantly reduced compared to the shRNANC group (P=0.0083), with statistically significant differences (P<0.05) (Figure 9). These findings indicate that PLOD2 affects the invasion ability of the cells.
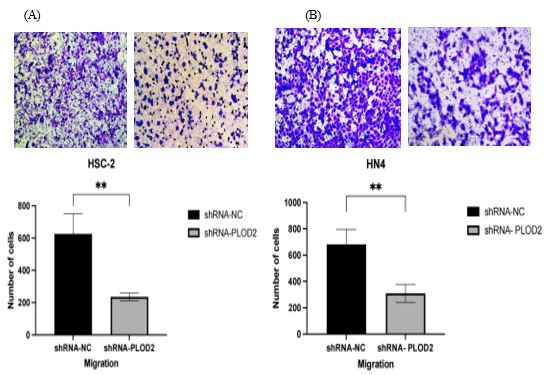
Figure 9: Transwell invasion assay to measure invasion ability of shRNA-PLOD2 HN4 and HSC-2 cell lines (P<0.05). (A) Invasion ability of HSC-2 with shRNA-PLOD2 and shRNA-NC. (B) Invasion ability of HN4 with shRNA-PLOD2 and shRNA-NC
Summary
PLOD2 is negatively correlated with overall survival in HNSC patients, indicating that higher expression of PLOD2 is associated with poorer prognosis, with statistical significance. The expression levels of PLOD2 are significantly elevated in oral cancer tissues compared to non-cancerous tissues. In the human oral squamous cell carcinoma cell lines HSC-2 and HN4, PLOD2 protein and mRNA expression levels are markedly increased compared to normal oral keratinocyte cell line HOK.
These findings suggest that PLOD2 expression may have potential value in predicting the prognosis of OCC, as high expression could indicate an unfavorable prognosis for OCC. PLOD2 may play a role as an oncogene in the development of oral cancer, indicating that it could serve as a novel tumor marker for oral cancer. This information could provide a basis and assistance for the diagnosis, treatment, and prognostic assessment of oral cancer.
Conclusion
PLOD2 does not affect the trends of cell proliferation and colony formation, but it significantly enhances the invasion and migration abilities of OSCC cells. This further indicates that PLOD2 acts as an oncogene in the process of tumor progression.
Discussion
Oral cancer is a common malignant tumor of the head and neck, known for its high lethality, with a mortality rate approaching 50%. It is one of the leading causes of death worldwide [14,15]. According to the latest data from GLOBOCAN, there are approximately 370,000 new cases of oral cancer and around 170,000 deaths globally each year, with the majority originating from the Asian continent. The World Health Organization predicts that the incidence of oral cancer will continue to rise over the coming decades [16,17]. Oral cancer primarily develops due to factors such as smoking, alcohol consumption, betel quid chewing, HPV infection, EBV infection, poor oral hygiene, and potentially malignant oral diseases [2,17]. Oral Squamous Cell Carcinoma (OSCC) is the most common type of oral cancer, accounting for over 90% of all oral cancer cases. Clinically, the most frequently affected sites in oral squamous cell carcinoma are the floor of the mouth, tongue, and lips, which exhibit high malignancy and relatively poor prognosis [19]. During the progression of oral cancer, the normal mucosa undergoes a series of histopathological changes, ranging from hyperplasia and dysplasia to cancer [16]. Currently, aside from dysplastic lesions that can be surgically removed, there are no effective interventions to prevent the transformation or progression of oral cancer. Despite significant advances in the detection and treatment of oral cancer, the 5-year overall survival rate remains only 50-60%, with approximately half of the patients who receive treatment succumbing to local recurrence and distant metastasis [17,19]. This may be attributed to a lack of specific biomarkers that correlate with the severity of disease progression and facilitate early detection of lesions. Biomarkers are products of malignant cells that can be used to assess the rate of malignant transformation and serve as targets for therapeutic interventions [19]. Therefore, the use of biomarkers for early, non-invasive detection of oral cancer aims to better identify high-risk patients for malignant transformation, prevent further progression to advanced stages, and develop effective treatment strategies.
Tumor metastasis is one of the primary causes of death in patients with oral cancer. Previous studies on tumor metastasis have mainly focused on the adhesion and migration abilities of cancer cells themselves; however, increasing evidence suggests that tumor occurrence and progression are determined not only by the tumor cells but also by the Tumor Microenvironment (TME) that supports the “seed and soil” hypothesis [10]. The TME is a highly complex system composed of tumor cells, infiltrating immune cells (such as macrophages, dendritic cells, and lymphocytes), cancer-associated stromal cells (such as cancer-associated fibroblasts, endothelial cells, and mesenchymal stem cells), and Extracellular Matrix (ECM) [20]. Among these, ECM plays a crucial role as one of the main components of TME in multiple stages of tumor progression, including adhesion, migration, proliferation, and differentiation [10]. The ECM is composed of extracellular macromolecules that provide a fundamental structural scaffold for cellular components, including collagen, elastin, laminin, and fibronectin [21]. Collagen, the primary structural protein of the ECM, accounts for approximately 30% of the total protein in the human body and is a stable protein with a long turnover time, playing an important role in tissue development, remodeling, and wound healing [22]. The degradation of collagen must be regulated at precise times and locations; uncontrolled degradation can lead to tumor progression [22]. Increasing evidence suggests that collagen is no longer just an obstacle to tumor cell migration and invasion but rather promotes metastasis based on different collagen-rich tissues, acting as a “highway” for cancer cell migration and invasion [7].
Studies of various human cancers indicate that enhanced covalent cross-linking of interand intramolecular structures can stabilize collagen accumulation [10]. PLOD2 specifically catalyzes the hydroxylation of lysine residues in the collagen propeptide region, which can directly alter the collagen fiber cross-linking pattern. This process forms cross-links through the hydroxylation of collagen terminal peptides and helical lysine residues, thereby determining different types of collagenous tissues. Thus, PLOD2 is a key enzyme mediating the formation of stable collagen cross-links [10].
PLOD2 has been confirmed to be regulated by HIF-1α, TGF-β1, and microRNA-26a/b, and it is overexpressed in various cancers, being closely associated with poor prognosis [7,23,24,25]. However, there is currently no literature that has simultaneously conducted experimental research on the oncogene PLOD2 in both oral cancer tissues and oral cancer cells.
In this study, we utilized bioinformatics to analyze the expression of the target gene in HNSC and to investigate its correlation with clinical survival and pathological features. The results indicated that PLOD2 is highly expressed in head and neck tumor tissues and is associated with patient survival, tumor stage, and differentiation status. Xu et al. [26] similarly explored the relationship between PLOD2 expression and renal cell carcinoma through bioinformatics data, discovering that the core gene PLOD2 is highly expressed in renal cell carcinoma and promotes the proliferation and invasion of renal cancer cells. Hu et al. [27] constructed a hypoxia and immunity-related gene model using bioinformatics to predict prognostic features in hepatocellular carcinoma, dividing patients into low-risk and high-risk groups, with PLOD2 identified as a high-risk gene associated with the prognosis of hepatocellular carcinoma. These findings align with our research results on PLOD2 gene expression in head and neck tumors, suggesting that PLOD2 may be a relevant factor for clinical prognosis.
In this study, the immunohistochemical results indicated that PLOD2 expression was significantly elevated in oral cancer tissues compared with non-cancerous oral tissues, which is consistent with our bioinformatics data analysis findings. Subsequently, we performed a correlation analysis between PLOD2 expression in oral cancer tissues and the patients’ clinical pathological characteristics, revealing that PLOD2 expression was not correlated with any pathological features. Kiyozumi et al. [28] also conducted a study on PLOD2, performing immunohistochemical analysis of PLOD2 expression in clinical samples from 179 gastric cancer patients and found that high PLOD2 expression was significantly associated with peritoneal dissemination, leading to poor prognosis. Xiaomeng et al. [29] investigated PLOD2 expression levels in tumor tissues and paired adjacent tissues from 172 patients with esophageal squamous cell carcinoma, analyzing the relationship between PLOD2 expression and clinical pathological parameters. They found that the expression level of PLOD2 was significantly higher in the tumor tissues of esophageal squamous cell carcinoma patients (70.35%, 121/172) compared to adjacent tissues (29.65%, 51/172), and that the co-expression of PLOD2 and ZEB1 was an independent prognostic factor for overall survival in these patients. Similarly, Sun et al. [30] performed immunohistochemical evaluations of 100 oral cancer tissues and also observed a significant increase in PLOD2 expression levels in oral tumor tissues. However, unlike our findings, Sun et al. discovered that while PLOD2 expression was not significantly correlated with gender, age, or stage, patients with high PLOD2 expression in oral tumor cells and fibroblasts exhibited poor differentiation, the worst invasion patterns, and more lymph node metastases, leading to a higher risk of postoperative metastasis and shorter survival times. This discrepancy with our study may arise from factors such as ethnic differences, indicating the need to expand the sample size, meticulously classify clinical case data, and integrate pathological features for more rigorous research. Such efforts would enhance our understanding of the comprehensive role of PLOD2 in tumor development and progression.
Finally, we utilized qRT-PCR and Western blotting to examine the expression levels of PLOD2 in Oral Squamous Cell Carcinoma (OSCC) cell lines HSC-2 and HN4 compared to normal human oral keratinocyte cell line HOK. The results showed that PLOD2 mRNA and protein levels were markedly elevated in HSC-2 and HN4 cells. Cellular assays primarily investigated the effects of PLOD2 on the biological behaviors of oral squamous carcinoma cells, including proliferation, colony formation, migration, and invasion. Our study found that HSC-2 and HN4 cells treated with shRNA-PLOD2 exhibited significantly inhibited invasion and migration. Similarly, Song et al. [31] observed dysregulation of PLOD2 in gliomas and demonstrated that PLOD2 promotes the proliferation, migration, and invasion of glioma cells in vitro. Di et al. [32] studied PLOD2 expression in esophageal squamous cell carcinoma and found that PLOD2 could enhance the migration and invasion capabilities of esophageal squamous carcinoma cells EC-109 in vitro. PLOD2 facilitates Epithelial-Mesenchymal Transition (EMT) through the FAK/AKT signaling pathway, thereby promoting the invasion and metastasis of esophageal squamous cell carcinoma. Through these in vitro experiments, we further validated that PLOD2 acts as an oncogene in oral cancer. In future research, we can investigate the upstream and downstream pathways associated with PLOD2, identifying proteins that co-participate with PLOD2, and subsequently study related inhibitors to enhance therapeutic efficacy for oral cancer.
In summary, PLOD2 is highly expressed in oral cancer and promotes the invasion and metastasis of oral cancer cells, playing a significant role in influencing the malignant biological behaviors associated with the development of oral cancer. Based on our research findings, PLOD2 holds promise as a novel molecular marker for the diagnosis of oral cancer or as a molecular therapeutic target.
Conclusion
Bioinformatics analyses demonstrate that PLOD2 is highly expressed in HNSC and is associated with prognosis. Similarly, PLOD2 is also highly expressed in oral cancer tissues and cells. Furthermore, PLOD2 significantly promotes the migration and invasion of OSCC cell lines HSC-2 and HN4 in vitro. This indicates that PLOD2 plays an oncogenic role in the progression of OCC and has potential value in predicting OCC prognosis. These findings suggest that PLOD2 could be targeted for OCC treatment, providing a basis and assistance for the diagnosis, treatment, and prognostic evaluation of oral cancer.
References
- Sung H, Ferlay J, Siegel RL, Laversanne M, Soerjomataram I, Jemal A, et al. Global cancer statistics 2020: GLOBOCAN estimates of incidence and mortality worldwide for 36 cancers in 185 countries. CA Cancer J Clin. 2021; 71: 209–49.
- Chai AWY, Yee PS, Price S, Lin YL, Shum DKY, Jiang Z, et al. Genome-wide CRISPR screens of oral squamous cell carcinoma reveal fitness genes in the Hippo pathway. Elife. 2020; 9: e57761.
- Tahmasebi E, Alikhani M, Yazdanian A, Yazdanian M, Tebyanian H, Seifalian A, et al. The current markers of cancer stem cell in oral cancers. Life Sci. 2020; 249: 117483.
- 魏向华. FGF3在口腔鳞癌中的表达及对口腔鳞癌细胞增殖与凋亡的影响 [Expression of FGF3 in oral squamous cell carcinoma and its effect on proliferation and apoptosis of oral squamous cell carcinoma cells] [dissertation]. 新疆: 新疆医科大学. 2021.
- Chattopadhyay I, Verma M, Panda M. Role of oral microbiome signatures in diagnosis and prognosis of oral cancer. Technol Cancer Res Treat. 2019; 18: 1533033819867354.
- Liu J, Lichtenberg T, Hoadley KA, Poisson LM, Lazar AJ, Cherniack AD, et al. An Integrated TCGA Pan-Cancer Clinical Data Resource to Drive High-Quality Survival Outcome Analytics. Cell. 2018; 173: 400–416.e11.
- Du H, Pang M, Hou X, Yuan S. PLOD2 in cancer research. Biomed Pharmacother. 2017; 90: 670–6.
- Qi Q, Huang W, Zhang H, Wang Y, Zhang Y. Bioinformatic analysis of PLOD family member expression and prognostic value in nonsmall cell lung cancer. Transl Cancer Res. 2021; 10: 2707–24.
- Wang Z, Fan G, Zhu H, Yu Z, He Y, Zhu J, et al. PLOD2 high expression associates with immune infiltration and facilitates cancer progression in osteosarcoma. Front Oncol. 2022; 12: 980390.
- Du H, Chen Y, Hou X, Yuan S, Pang M. PLOD2 regulated by transcription factor FOXA1 promotes metastasis in NSCLC. Cell Death Dis. 2017; 8: e3143.
- Song Y, Zheng S, Wang J, Long H, Fang L, Wang G, et al. Hypoxiainduced PLOD2 promotes proliferation, migration and invasion via PI3K/Akt signaling in glioma. Oncotarget. 2017; 8: 41947–62.
- He JY, Wei XH, Li SJ, Liu Y, Hu HL, Chen J, et al. Adipocyte-derived IL-6 and leptin promote breast cancer metastasis via upregulation of lysyl hydroxylase-2 expression. Cell Commun Signal. 2018; 16: 100.
- Sheng X, Li Y, Li Y, Chen B, Zheng Y. PLOD2 contributes to drug resistance in laryngeal cancer by promoting cancer stem cell-like characteristics. BMC Cancer. 2019; 19: 840.
- Wong T, Wiesenfeld D. Oral cancer. Aust Dent J. 2018; 63: S91–9.
- Lin X, Wu W, Ying Y, Wang W, Li J, Chen L. MicroRNA-31: a pivotal oncogenic factor in oral squamous cell carcinoma. Cell Death Discov. 2022; 8: 140.
- Kumari P, Debta P, Dixit A. Oral potentially malignant disorders: etiology, pathogenesis, and transformation into oral cancer. Front Pharmacol. 2022; 13: 825266.
- Bouaoud J, Bossi P, Elkabets M, Badoual C. Unmet needs and perspectives in oral cancer prevention. Cancers (Basel). 2022; 14: 1815.
- Nijakowski K, Gruszczyński D, Kopała D, Surdacka A. Salivary metabolomics for oral squamous cell carcinoma diagnosis: a systematic review. Metabolites. 2022; 12: 294.
- Bommanavar S, Kanetkar SR, Datkhile KD, Datar UV, Patil SR, Ingle A. Membrane-organizing extension spike protein and its role as an emerging biomarker in oral squamous cell carcinoma. J Oral Maxillofac Pathol. 2022; 26: 82–6.
- Mao X, Xu J, Wang W, Liang C, Hua J, Liu J, et al. Crosstalk between cancer-associated fibroblasts and immune cells in the tumor microenvironment: new findings and future perspectives. Mol Cancer. 2021; 20: 131.
- Lee S, Lim GE, Kim YN, Kim HS, Park JY, Kim HJ, et al. AP2M1 supports TGF-β signals to promote collagen expression by inhibiting caveolin expression. Int J Mol Sci. 2021; 22: 1639.
- Cheriyamundath S, Kumar A, Gavert N, Slorach EM, Ben-Ze’ev A. The collagen-modifying enzyme PLOD2 is induced and required during L1-mediated colon cancer progression. Int J Mol Sci. 2021; 22: 3552.
- Li G, Wang X, Liu G. PLOD2 is a potent prognostic marker and associates with immune infiltration in cervical cancer. Biomed Res Int. 2021; 2021: 5512340.
- Li F, Liu H, Zhang K, Ma S, Xu Y. Adipose-derived stromal cells improve functional recovery after spinal cord injury through TGF-β1/Smad3/PLOD2 pathway activation. Aging (Albany NY). 2021; 13: 4370–81.
- Gjaltema RAF, Goubert D, Huisman C, Korf B, Bank RA. KRAB-induced heterochromatin effectively silences PLOD2 gene expression in somatic cells and is resilient to TGFβ1 activation. Int J Mol Sci. 2020; 21: 3634.
- Xu F, Guan Y, Xue L, Yang H, Li Y, Li T, et al. The effect of a novel glycolysis-related gene signature on progression, prognosis and immune microenvironment of renal cell carcinoma. BMC Cancer. 2020; 20: 1207.
- Hu B, Yang XB, Sang XT. Development and verification of the hypoxia-related and immune-associated prognosis signature for hepatocellular carcinoma. J Hepatocell Carcinoma. 2020; 7: 315–30.
- Kiyozumi Y, Iwatsuki M, Kurashige J, Iwagami S, Eto K, Kubota H, et al. PLOD2 as a potential regulator of peritoneal dissemination in gastric cancer. Int J Cancer. 2018; 143: 1202–11.
- Gong X, Wang A, Song W. Clinicopathological significances of PLOD2, epithelial-mesenchymal transition markers, and cancer stem cells in patients with esophageal squamous cell carcinoma. Medicine (Baltimore). 2022; 101: e30112.
- Sun Y, Wang S, Zhang X, Liu Y, Gong L, Zhang N, et al. Identification and validation of PLOD2 as an adverse prognostic biomarker for oral squamous cell carcinoma. Biomolecules. 2021; 11: 1842.
- Song Y, Zheng S, Wang J, et al. Hypoxia-induced PLOD2 promotes proliferation, migration and invasion via PI3K/Akt signaling in glioma. Oncotarget. 2017; 8: 41947-41962.
- Di WY, Kang XH, Zhang JH, Zhang J, Shen XH. Expression of PLOD2 in esophageal squamous cell carcinoma and its correlation with invasion and metastasis. Zhonghua Bing Li Xue Za Zhi. 2019; 48: 102–7.